1 Introduction
The wind generators are machines responsible for transforming
the kinetic energy of the wind into mechanical energy by rotating the blades of
a rotor that, connected to a generator, is capable of converting mechanical
energy into electricity. Their increasing use in the global scenario have also
led to the need for constant studies related to their control systems in order
to guarantee the integrity of the tower, wind turbine and mechanical
components, as well as to guarantee good operating performance. Among the
different aspects existing in control systems, such as overcurrent control,
short circuits, overvoltage, and others, there is a concern about the efficient
control of the structure's vibration [1, 2, 3].
The wind tower is an important component of the wind system,
as it is responsible for sustaining the wind turbine. Over time, a notable
factor is the increase in the height of these towers, subjecting the entire
structure and mechanical components to greater vibration effects, thus
demonstrating the importance of introducing an adequate structural vibration
control [4].
Devices such as TMD (Tuned Mass Damper), Controllable Fluid
Dampers, TLD (Tuned Liquid Dampers, among others, can be used in order to
promote structural vibration control. The dampers can also be classified as
passive, active or semi-active, where the main difference is in the use or not
of external power to absorb vibration energy. In a passive system this control
occurs only due to the presence of springs and dampers, or even a pendulum,
while in an active system the control occurs by adding an active element, being
possible to find in the system controllers and actuators, responsible for
calculating the necessary force to control the vibration and apply it to the
structure. A semi-active system, in turn, uses external energy only in the
modification of the stiffness and damping parameters of the device, not on
direct application in the vibration attenuation as in the active control [3, 5].
2 Tuned Mass
Damper (TMD) and its Optimal Parameters
The TMD is characterized by the use of a mass  , a spring of stiffness
  and a damper of
coefficient
and a damper of
coefficient  , where tuning its natural
frequency to the frequency to be controlled, this device is able to control the
vibration of the structure where it was implemented. An alternative geometry
for the TMD is the pendulum, where it is modeled with a hanging mass that sways
in the opposite movement to the excited structure. TMD has great applicability
in tall buildings, bridges, towers and, also, in wind towers, and can be used
as a passive, active or semi-active device. It is usually located at the point
of greatest modal amplitude, in order to attenuate the vibrations related to
the first mode of vibration [3, 5].
, where tuning its natural
frequency to the frequency to be controlled, this device is able to control the
vibration of the structure where it was implemented. An alternative geometry
for the TMD is the pendulum, where it is modeled with a hanging mass that sways
in the opposite movement to the excited structure. TMD has great applicability
in tall buildings, bridges, towers and, also, in wind towers, and can be used
as a passive, active or semi-active device. It is usually located at the point
of greatest modal amplitude, in order to attenuate the vibrations related to
the first mode of vibration [3, 5].
The
parameters of stiffness, mass and damping of a TMD can be calculated from the
dynamic equilibrium equations of the Structure-TMD system. It is commonly used
to reduce the degrees of freedom of the structure, simplifying the system and
facilitating the calculation procedures. It is also important to know the
frequency at which the TMD should act and the structure's damping. TMD
parameters must be dimensioned in order to obtain the best possible vibration
control results, that is, minimizing the amplitude of movement of the structure.
In the response of a 2 degree of freedom system, for example, in the frequency
domain graph, there are two points where all curves pass, regardless of the
value of the TMD damping factor,  . The so-called ideal curve
is one where these two points are equivalent to the peaks of the curve (that
is, zero slope), and whose height of both points tend to the same value. Then
applying these conditions, the so-called optimal parameters of the TMD are
obtained [6, 7].
. The so-called ideal curve
is one where these two points are equivalent to the peaks of the curve (that
is, zero slope), and whose height of both points tend to the same value. Then
applying these conditions, the so-called optimal parameters of the TMD are
obtained [6, 7].
For
the case of a mass subject to free vibration where a TMD is introduced, the
result is a system of 2 degrees of freedom as shown in Figure 1, governed by
the dynamic equilibrium equations shown in Equation (1), where the parameters
with index  represent TMD, and with
index
represent TMD, and with
index  represent the main mass.
Figure 1: Theoretical model of 2 DOF representing a structure with
damping and with a TMD installed, subject to free vibration [adapted].
Source:
Paredes, M. M. [6].
For this case, after application of the previously mentioned
conditions and performing the proper mathematical calculations, it’s possible
to get the following equations of optimal parameters  and of TMD shown in Equations
(2) and (3), where is the ratio of
frequencies of the TMD and mass (
and of TMD shown in Equations
(2) and (3), where is the ratio of
frequencies of the TMD and mass ( ), and
  are the factor damping of
TMD and mass respectively, and
are the factor damping of
TMD and mass respectively, and  is the mass ratio (𝜇 =
  ) [6].
As mentioned, these equations correspond to the case of a
mass subject to free vibration, but will vary depending on the conditions under
which the system is subject, such as harmonic or random actions.
This work aims to propose a TMD to act on the first natural
frequency of a wind tower subject to free vibration, dimensioning its optimal
parameters and evaluating its influence on the system.
3 Methodology
3.1 Dynamic
Analysis of Wind Tower
For
this study, a small wind tower present on the Campus of the Polytechnic
Institute of Bragança (IPB), with peak power equal to 1.4 kWp, was used as the
object of study, as shown in Figure 2.
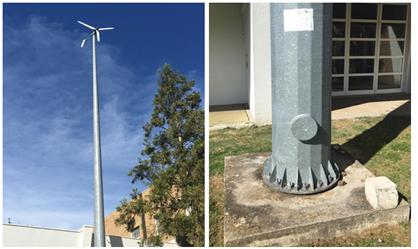
(a)
(b)
Figure 2: Horizontal-axis wind tower of the IPB Campus - (a) Wind
generator and part of the tower, (b) bottom of the tower.
Source:
Author.
The tower was modeled numerically using the finite element
method in the ANSYS software. Then, from the dynamic analysis it was possible
to obtain its natural frequencies and modes of vibration. For this purpose,
simulations were made considering the upper end of the structure as being free
and its base fixed, since this configuration is considered in the bibliography
as a good initial approximation of a real structure base [9].
The structure was initially designed in the Autodesk Inventor
software, not taking into account the ladder and structural defects, and the
introduction of the wind turbine on the tower was made in a simplified way,
where this was represented by a massive box fitted on the top of the structure,
having weight equivalent to the total weight of the rotor.
Simplifications of nacelle consist of a satisfactory
simulation practice, which is also used in other works [8, 9, 10,
11, 12].
The wind towers are subjected to different dynamic stresses due to, for
example, the rotor rotation, the action of the wind, and the blade pass through
the tower. However, in this paper, these dynamic effects will not be included,
since the focus here is on observing the natural frequencies of the structure,
analyzing the natural vibration of the tower when subjected only to free
vibration.
The mesh was then created in the structure using the ANSYS
software, which can be seen in Figure 3. In this step, the convergence of the
results in relation to the first natural frequency of the system was
considered, where in Figure 4 it is possible to see the amount of elements
generated, as well as the first natural frequency equivalent to 1.56 Hz.
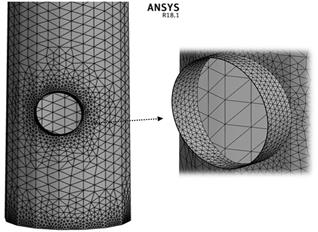
(a)
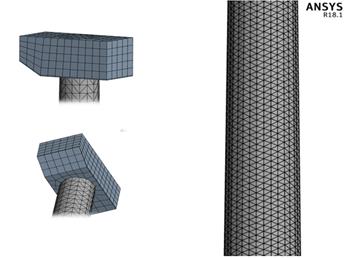
(b)
Figure 3: Meshes in - (a) proximity
to the hole and base, (b) tower and upper part.
Source: Author.
Figure 4: Mesh convergence.
Source: Author.
As a parameter for analyzing the frequencies obtained
numerically, the results obtained experimentally by Dias, L. [13] will be considered. In the
test, two accelerometers were used at a height of 1.41 m in two different positions
(x and y). The tower was excited using a PCB 086b20 impact hammer, and the
first average frequencies obtained can be seen in Table 1. For this test,
intermediate vibrations were not taken into account, such as vibrations in the
wind turbine, and the frequency spectrum obtained in the test can be seen in
Figure 5.
Table 1: Frequencies obtained experimentally.
|
Frequencies (Hz)
|
|
First
mode of vibration
|
1.61
|
|
Second
mode of vibration
|
5.99
|
Source: Dias, L. [13].
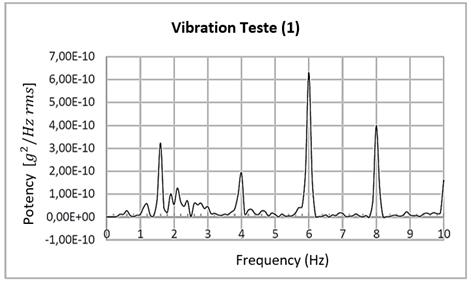
Figure 5: Spectrum of frequencies obtained
experimentally. [adapted].
Source: Dias, L. [13].
3.2 Proposal of
a TMD for the structure
Tuning the TMD means choosing the appropriate mass, stiffness
and damping parameters for a given actuation frequency, so that the movement of
the main structure be minimized. Therefore, first the structure is reduced in
an equivalent mass-spring system of 1 DOF, where its structural parameters are
replaced by its modal (or generalized) parameters that correspond to the mode
of vibration in which the TMD will act. Figure 6 shows schematically this
system of 1 DOF, representing the first mode of flexion of the structure, where
 and
and  correspond to the modal
stiffness and mass. The modal mass is obtained from ANSYS itself, and with
that, the modal stiffness can be calculated, since the values of and natural frequency
correspond to the modal
stiffness and mass. The modal mass is obtained from ANSYS itself, and with
that, the modal stiffness can be calculated, since the values of and natural frequency  are known. Considering
that steel towers have, in particular, a lower level of structural damping [14, 15], it was considered for
this first approach that the structural damping is approximately zero. In
addition, for cases where this value is reduced (
are known. Considering
that steel towers have, in particular, a lower level of structural damping [14, 15], it was considered for
this first approach that the structural damping is approximately zero. In
addition, for cases where this value is reduced ( ), the design of the TMD
can be performed considering the damping of the structure as zero [7].
), the design of the TMD
can be performed considering the damping of the structure as zero [7].
(a) (b)
Figure 6: (a) Flexion mode (b)
simplified to a modal mass-spring system.
When
introducing the mass-spring-damper TMD into the structure, the system then
changes from 1 DOF to 2 DOF, as shown in Figure 7, where , , and correspond to the
stiffness, damping coefficient and mass of the TMD, respectively, and the
dynamic equilibrium equations of this system can be seen in Equation (4). These
parameters are then dimensioned from the equations of optimal parameters, as
shown in Equations (2) and (3), where adapting them to the system in Figure 7,
they become as follows, as shown in Equations (5) and (6).
Figure 7: Mass-spring system with
coupled TMD.
The mass of the TMD should be chosen
initially, where it is suggested that its value be about 0.5% to 1% of the
total mass of the structure, and in towers of larger size it is also observed
the use of values around 3% [10, 16]. The total mass of the
structure can also be obtained using ANSYS. From the pre-determination of and the knowledge of the
modal mass , it is then possible to
find the mass ratio , and calculate  and
and  , from where it will be
possible to obtain the stiffness and damping parameters of TMD, as well as its
frequency
, from where it will be
possible to obtain the stiffness and damping parameters of TMD, as well as its
frequency  .
.
After obtaining the TMD’s parameters, the system response is
simulated using the MATLAB software, where an algorithm was developed based on
the previous equations. The tool used to solve the system of differential
equations was ODE45 through the application of the fourth-order Runge-Kutta
Method. The FFT (Fast Fourier Transform) function was also used to obtain the
system's response in the frequency domain.
4 Results and
Discussion
4.1
Dynamic Analysis
From the dynamic analysis performed in ANSYS it was possible
to obtain the natural frequencies and modes of vibration of the structure. It
was observed that for each pair of frequencies the values were very close. The
first two pairs of frequencies obtained numerically are shown in Table 2.
Table 2: Natural frequencies obtained numerically.
|
Frequencies (Hz)
|
|
First
mode of vibration
|
1.56
|
|
Second
mode of vibration
|
1.59
|
|
Third
mode of vibration
|
6.79
|
|
Fourth
mode of vibration
|
6.89
|
Source: Author.
It was
also possible to observe that for each pair of frequencies the modes of
vibration are similar, acting however in opposite directions. Figure 7 shows
the first and second modes of vibration of the structure, corresponding to
flexion modes, where what differentiates them is the direction of action, one
in the X direction and the other in the Z direction. Since the first modes of
vibration are the most important and likely to occur, then the other modes will
not be placed here.
(a) (b)
Figure 7: (a) 1st and (b) 2nd mode of
vibration.
Thus, given the similarity to each pair of frequencies, the
average of these pairs will now be considered, that is, the first frequency
corresponds to the average of the first pair of similar frequencies, and the
second frequency to the average of the second pair of similar frequencies.
4.2
Comparison of Numerical and Experimental Results
From the values of frequency obtained
experimentally, presented in Table 1, and the values of frequency obtained
numerically (considering the average of the pairs of frequency), it is possible
to observe a small error related to the first natural frequency, equivalent to
1.86%, and a 14.19% error related to the second frequency, as shown in Table 3.
Table 3: Experimental and numerical
frequency results and respective errors.
|
Natural Frequency
|
Experimental
|
Numerical
|
Error (%)
|
|
First
mode of vibration (Hz)
|
1.61
|
1.58
|
1.86 %
|
|
Second
mode of vibration (Hz)
|
5.99
|
6.84
|
14.19 %
|
Source: Author.
Then, considering that the first frequency was the best
observed numerically and experimentally, and because it is considered the main
one it was then considered as a parameter of TMD tuning. Therefore, TMD will
act when this frequency is reached, vibrating out of phase in relation to the
movement of the structure.
Some factors may have contributed to
the reported differences such as, for example, the simplification of the
numerical model of the tower, where the ladder present in the structure,
structural defects, and the real shape of the wind turbine were not considered.
The wind turbine was simplified as a slightly decentralized solid box at the
top of the tower, aiming to simulate the effect of the rotor’s center of
gravity on the response of the structure, but being an approximation since the
real value is not known.
Another reason for such differences
may have been due to the experimental test, where vibrations from the wind
turbine may have generated interference in the results. The test performed was
an environmental vibration test, that is, the response of the structure was
obtained being subject to its working and operating conditions. Environmental
vibration tests like this provide large amounts of data that need to be handled
carefully, as the captured signal receives contribution from various
frequencies, such as wind, rotor and blade rotation, and also from the
generator. Therefore, being this type of signal considered white noise, the
natural frequencies of the structure can be recognized through the
identification of frequencies with higher energy content. Therefore, a small
flaw in this identification can also be considered as the cause of the
difference in the results. In addition, the position of the sensors may have
been another cause of the observed differences, where it is suggested that they
be used at different points of the structure for a more satisfactory test.
4.3 Optimal
TMD’s parameters and response of the structure
Initially, the mass of the TMD was considered to be 1% of the
total mass of the structure (equivalent to approximately 752.37 kg), which
corresponds to = 7.52 kg. The modal mass
referred to the first mode of vibration ( =1.58 Hz, equivalent to = 9.93 rad/s) is obtained
from numerical analysis, and corresponds to = 353.28 kg. With this,
the modal stiffness is
=1.58 Hz, equivalent to = 9.93 rad/s) is obtained
from numerical analysis, and corresponds to = 353.28 kg. With this,
the modal stiffness is

The mass ratio is equivalent to
With the value of , the frequency value of
TMD is found, in order to obey the optimal ratio of frequencies . Therefore,

From Equation (6) it is also possible to find the optimal
value of the damping factor for TMD, from where the damping coefficient will be obtained.

With these values of and , the stiffness required
for TMD will be

Table 4 presents, briefly, the values of the parameters
obtained for the TMD.
Table 4: TMD’s parameters for
vibration control of the first mode of vibration of the structure.
|
Parameter
|
Value
|
Unit
|
|
Mass
|
7.52
|
kg
|
|
Stiffness
|
711.65
|
N/m
|
|
Damping
|
20.48
|
N.s/m
|
Once the optimal TMD parameters were determined, it was then
possible to obtain the system response graphs shown in Figure 8, through
MATLAB.
Figure 8: Response of the spring-mass system with and without coupled
TMD, in the time and frequency domain:  =7.52kg,
  =711.65 N/m,
  =20.48 N.s/m.
As can be observed, the presence of TMD resulted in the rapid
attenuation of the tower vibration. The two new frequencies obtained for the
present case were  =1.56 Hz and
  =1.57 Hz as can be seen in
the frequency domain response graph. In this same graph it is possible to
visualize the detachable difference that exists in the amplitude for the
frequencies of the system without TMD and with TMD, where these amplitudes are related
to the amount of energy in the vibration movement for the simulation time
considered. Therefore, the system response without TMD presents the highest
peak because throughout the simulation time its vibratory energy is constant,
while the system response with TMD presents much smaller amplitudes, for the
mass of the TMD and for the mass of the tower, because during the simulation
time both masses present a decrease of their vibration energy.
=1.57 Hz as can be seen in
the frequency domain response graph. In this same graph it is possible to
visualize the detachable difference that exists in the amplitude for the
frequencies of the system without TMD and with TMD, where these amplitudes are related
to the amount of energy in the vibration movement for the simulation time
considered. Therefore, the system response without TMD presents the highest
peak because throughout the simulation time its vibratory energy is constant,
while the system response with TMD presents much smaller amplitudes, for the
mass of the TMD and for the mass of the tower, because during the simulation
time both masses present a decrease of their vibration energy.
Increasing the mass , it was observed that the
vibration attenuation occurs faster and that the amplitude of the displacement
suffered by the TMD becomes smaller. In addition, from the frequency domain
graph it was noticed that the peaks of the curve of the Tower-TMD system become
smaller and closer to each other in height [17]. This can be observed in
Figure 9, where was increased by 10% of
the total mass of the structure and the other parameters were updated within
the optimal conditions. However, although the use of a larger mass is
apparently a good choice, it is advisable to evaluate the design limitations such
as, for example, the space available in the tower for TMD installation.
Figure 9: Response of the spring-mass system with and without coupled
TMD, to  equal to 10% of the total
mass of the structure:=75.24 kg, =5108.62 N/m, =520.78 N.s/m.
equal to 10% of the total
mass of the structure:=75.24 kg, =5108.62 N/m, =520.78 N.s/m.
4.4 Influence of
the change of TMD’s parameters on the structure response, without the correct
adequacy to optimal conditions
Now, through the variation of TMD parameters so that they
disperse from their optimal values, it will be possible to observe how the
vibration attenuation of the structure occurs and, consequently, to evaluate
what is the need to use the equations of optimal parameters correctly.
First, the mass was varied, where the
other parameters and were kept constant, that
is, they were not updated according to the equations of optimal parameters.
Figure 10 shows the answer for the case of =4.51 kg, that is, reduced
by 40% of its initial value. Figure 11 shows the answer for the case of =10.53 kg, that is,
increased by 40%.
Figure 10: Response of the spring mass system with and without coupled
TMD, to reduced by 40% (=4.51 kg), and =711.65 N/m, =20.48 N.s/m.
Source: Author.
Figure 11: Response of the spring-mass system with and without coupled
TMD, to m_t increased by 40% (=10.53 kg), and =711.65 N/m, =20.48 N.s/m.
In both graphs, less efficient results in vibration
attenuation are observed, mainly with reduction. In cases where
the parameters are even more distant from their optimal values, it is possible
to observe situations where attenuation does not occur, as shown in Figure 12.
Figure 12: Response of the mass-spring system with and without coupled
TMD, to =9 kg, =3 N/m and =20040 N.s/m.
It
is also valid to point out that, in cases where the TMD is designed to act when
a certain external force is applied, if its parameters are not carefully
implemented, it will be possible to observe that there may be an increase in
the dynamic amplitude of the tower.
Similarly, the damping was also varied, where the
other parameters and were kept constant, that
is, they were not updated according to the equations of optimal parameters.
Figure 13 shows the answer for the case of = 4.08 N.s/m, that is,
reduced by 80% of its initial value. Figure 14 shows the answer for the case of
= 36.80 N.s/m, that is,
increased by 80%.
Figure 13: Response of the spring-mass system with and without coupled
TMD, to reduced by 80% (=4.08 N.s/m), and =711.65 N/m, =7.52 kg.
Figure 14: Response of the spring-mass system with and without coupled
TMD, to increased by 80% (=36.80 N.s/m), and =711.65 N/m, =7.52 kg.
With
the reduction of the damping coefficient, it is observed that the displacement
of the TMD starts to present greater amplitudes, and the vibration of the tower
remains for a longer time. It is also possible to notice the inconsistency in
the vibration attenuation, where in some periods there is a slight increase in
the vibration where it immediately reduces again. On the other hand, with the increase
of the damping coefficient, the TMD starts to present smaller displacements,
but the time of vibration attenuation of the tower continues to be greater than
the time observed in the responses obtained through the optimal parameters
(Figures 8 and 9).
In all cases, it is notable that the responses tend to
be more efficient as the TMD’s parameters converge to their values considered
optimal.
As a last consideration, it is worth noting that, since free
vibration has been treated here, the amplitude of the masses displacements
observed in the responses is dependent on the initial displacement of the tower
adopted in the simulations (this is a case of a Possible and Indeterminate
System). However, in a constructive TMD project, it is important that an experimental
study of the tower vibration amplitudes be carried out, thus obtaining adequate
initial conditions for the simulation. Depending on these conditions, the
diameter of the tower where the TMD would be installed (upper internal
diameter) must be large enough to allow the displacement of and to accommodate the
other elements of the system, such as spring, damper and guides. However,
regardless of such imposed conditions, the application of the optimal
parameters of the TMD will imply an optimized attenuation of the tower
vibration.
The construction and implementation of the TMD would consist
of another stage of the study, where it would be necessary to gather the design
restrictions, from the dimensions to the limited commercial availability of
elements (as is the case of the dampers in relation to their damping factor).
In this work, constructive details are not within the objective. However, Figure
15 schematically shows a possible arrangement of the elements in the system,
where the ends would be fixed to the internal walls of the tower (the TMD could
also, alternatively, be implemented inside the nacelle, or even outside the
tower, which possibly require a different arrangement of the elements).
However, this is only a possible implementation, as the elements (spring and
damper) could also be placed both on the same side, as shown by LIMA, D. M. [10]. He proposes a constructive
model, where guides and rails are implemented for the translation of the mass
in the correct direction. It is also worth mentioning that TMD should act in two
different directions (X and Z) regarding the 1st and 2nd modes of vibration of
the tower (see Figure 7), therefore two complete TMDs can be applied to the
system (one for each direction mentioned), or a special arrangement for just
one TMD must be developed taking in consideration acting in two direction.
Figure 15: Scheme showing possible arrangement of system elements.
5. Conclusions
Through the dynamic analysis of a wind tower, performed
numerically, it was possible to extract information of frequency and modes of
vibration of the tower, where when comparing them with experimental results,
the first frequency was the one that presented the most satisfactory result,
what made this frequency chosen for TMD tuning. These differences may have
resulted from simplifications of the numerical model, or from possible errors
in the identification of natural frequencies through experimental analysis,
since in an environmental vibration test the structure receives the
contribution of different excitation frequencies, and then, the natural
frequencies must be carefully identified through the energy content of the
signals obtained.
In the proposal of a TMD for the structure it was possible to
verify that the use of the equations of optimal parameters generated
satisfactory results, providing the best result in the vibration attenuation of
the tower. This statement could be confirmed by observing that the results were
more efficient when the TMD’s parameters converged to their values considered optimal.
For the simulated case, of free vibration, the system is not
being continuously excited by external force and, therefore, in the simulation
it is only observed how fast or slow the vibration attenuation occurs due to
the variations in the parameters. However, in case of simulations with forced
systems, the inappropriate use of TMD parameters can lead to amplification of
the system’s vibration, causing the resonance effect, and that would be a
proposal for future work.
References
[1] RITCHIE, H; ROSER, Ma. - Energy
Production & Changing Energy Sources: Our World in Data, 2019. Available
in: <URL: https://ourworldindata.org/energy-production-and-changing-energy-sources>. [Consult.
2019-11-05].
[2] MANWELL, J. F.; MCGOWAN, J. G.; ROGERS, A. L. – Wind Energy
Explained: Theory, Design and Application. 2ª Ed. London: WILEY, 2009.
[3]
RAHMAN, M.;
Et. al. – Performance enhancement of wind turbine systems with vibration control:
A review – Renewable and Sustainable Energy Reviews – Malaya (2015-06-19) –
51:43-54. http://dx.doi.org/10.1016/j.rser.2015.05.078.
[4] GASCH, R.; TWELE, J. – Wind Power Plants: Fundamentals,
Design, Construction and Operation. 1ª Ed. Berlin: Taylor&Francis Ltd,
2002.
[5] COLHERINHAS, G. B. ; Et al. – Wind Tower Vibration Controlled by a
Pendulum TMD using Genetic Optimization: Beam Modelling – Procedia Engineering
– Brasília (2017) - 199: 1623-1628. DOI:10.1016/j.proeng.2017.09.080.
[6]PAREDES, M. M. – Utilização de
Amortecedores de Massas Sintonizadas no Controlo de Vibrações em Estruturas.
Dissertação de Mestrado em Engenharia Civil – Faculdade de Engenharia da
Universidade do Porto (FEUP), 2008. Available in: <URL:https://repositorio-aberto.up.pt/bitstream/10216/59514/1/000129395.pdf>. [Consult. 2020-03-11].
[7]
MOUTINHO, C. M. R. –
Controlo Passivo e Activo de Vibrações em Pontes de Peões. Dissertação de
Mestrado em Estruturas de Engenharia Civil – Faculdade de Engenharia do Porto
(FEUP), 1998. Available
in: <URL: https://repositorio-aberto.up.pt/bitstream/10216/12999/2/Texto%20integral.pdf>. [Consult. 2020-03-06].
[8]
SIRQUEIRA, A. S. –
Comportamento Estrutural de Torres de Aço para Suporte de Turbinas Eólicas.
Dissertação de Mestrado em Engenharia Civil – Universidade do Estado do Rio de
Janeiro (UERJ), 2008. Available in: <URL:http://www.labbas.eng.uerj.br/pgeciv/nova/files/dissertacoes/22.pdf>. [Consult. 2020-03-11]
[9]
OLIVEIRA, L. F. M. P.
– Análise do Comportamento Dinâmico de Torres de Geradores Eólicos. Dissertação
de Mestrado em Engenharia Civil, Especialização em Estruturas – Faculdade de
Engenharia do Porto (FEUP), 2012. Available in: <URL:https://repositorio-aberto.up.pt/bitstream/10216/68265/1/000154677.pdf>. [Consult. 2020-03-06]
[10] LIMA, D. M. – Análise
da estabilidade elástica, análise dinâmica e controle de vibração em torres
tubulares de aço para aerogeradores de eixo horizontal. Tese de Doutorado em
Engenharia Civil – Universidade Federal de Pernambuco (UFPE), 2018. Available in:
<URL: https://attena.ufpe.br/bitstream/123456789/31108/1/TESE%20Douglas%20Mateus%20de%20Lima.pdf>. [Consult. 2021-01-15]
[11] DAGLI, B. Y. ; TUSKAN, Y. ; GOKKUS, U. –
Evaluation of Offshore Wind Turbine Tower Dynamics with Numerical Analysis –
Advances in Civil Engineering - Turkey (2018) – Article ID 3054851. https://doi.org/10.1155/2018/3054851.
[12] MURTAGH, P. J. ; BASU, B. ; BRODERICK, B. M. –
Simple models for natural frequencies and mode shapes of towers supporting
utilities – Computers & Structures – Ireland (2004) – 82: 1745-1750. https://doi.org/10.1016/j.compstruc.2004.04.005.
[13]
DIAS, L. D. –
Proposta de um Modelo de Cálculo para o Dimensionamento de uma Torre Eólica a
partir da Análise Dinâmica e Estática. Dissertação de Mestrado em Engenharia da
Construção – Instituto Politécnico de Bragança (IPB), 2018. Available in: <URL:https://bibliotecadigital.ipb.pt/bitstream/10198/18298/1/pauta-relatorio-11.pdf>. [Consult. 2020-03-02]
[14] LIMA, D. M. ; LÓPEZ-YÁNEZ, P. A. ; PEREIRA, M.
A. – Vibration control device for steel tubular towers of Horizontal Axis
Wind Turbines – Lat. Am. J. solidus struct – Rio de Janeiro, Brasil (2019) – 6,
n. 16. https://doi.org/10.1590/1679-78255436.
[15] ASSOCIAÇÃO BRASILEIRA
DE NORMAS TÉCNICAS. NBR 6123:1998, versão corrigida 2:2013. Forças devidas ao
vento em edificações. Rio de Janeiro: ABNT, 2013.
[16] HOUSNER, G. W.; Et al. –
Structural Control: Past, Present, and Future – Journal of Engineering
Mechanics – Reston (1997, September) – 123(9):897-971.https://doi.org/10.1061/(ASCE)0733-9399(1997)123:9(897).
[17] LU, Z. ;
WANG, D. ; LI, P. – Comparison Study of Vibration Control Effects between
Suspended Tuned Mass Damper and Particle Damper – Shock and Vibration – China
(2014) – Article ID 903780. http://dx.doi.org/10.1155/2014/903780.