1
Introduction
In
the past few years, Learning Management Systems (LMSs) have been widely adopted
in the field of Distance Education. These systems provided a quick access to
educational tools and contents that were integrated into the same space. With
this in mind, a significant amount of educational data was being stored and the
research area of Educational Data Mining (EDM) came up to generate knowledge by
analyzing this data. Data Mining applied specifically to education has been
increasing, even though the pace is not as fast as in e-commerce [1].
Essentially,
EDM merges concepts of Computer Science and Statistics in order to construct
insights about educational information. Considering the fact that Education is
also a key area of EDM, people with non-technical skills should be able to deal
with EDM tools. However, nowadays it seems that one needs to know Data Mining,
Learning Analytics and even Machine Learning Algorithms to use EDM. A larger
fraction of the population can improve the state of education through EDM [2].
With
that in mind, the processes of building EDM tools need to consider an unusual
target audience in order to expand its use, traditionally it was assumed that
technical understanding was a must. But, one way to understand how to
successfully reach this audience is delivering a system that was built thinking
about the user experience of these new users that don’t really have a prior
knowledge of Data science in general.
User
Experience (UX) has been playing a major role in development teams, no matter
which development stage you’re involved. UX evaluation provides a better
understanding of the end users and helps you recognize design mistakes [3]. Some studies have focused
on the importance of a positive user experience of LMSs. Usability of
e-learning systems is crucial to improve the acceptance of these systems for
students, the main target audience of LMSs [4].
In
this paper we aim to analyze how an EDM framework can elevate its usability so
non-technical users can have a better user experience. That being said, we are
going to evaluate a system called FMDEV (Framework de Mineracão de Dados
Educacionais). ˜ This framework was developed to generate models through Data
Mining and Machine Learning to provide relevant information about educational
phenomena. The main objective is to explore FMDEV’s level of compliance with
established usability heuristics by identifying usability problems, and then validate
through a usability test if the found problems were actually affecting the
target audience experience.
2
Background
This
section presents theoretical fundamentals to facilitate the understanding of
this paper through a literature review and concepts definitions.
2.1
Educational
Data Mining
Educational
Data Mining Educational Data Mining (EDM) is a field that studies educational
data sets to recognize a way to deal with educational issues. Using Statistics,
Data Mining and Machine Learning techniques, EDM grants the possibility of
having useful information to a broad number of stakeholders. Data Mining
applied in variant domains have their particular obstacles and EDM is no
different [1]. The fact that educational phenomena and additional
pedagogical aspects need to be considered might require unique Data Mining
techniques.
Moreover,
the knowledge provided by Learning Management Systems data contributes to a
better understanding of student behavior when user centered design is taken
into account [5]. In this way, Education, Data Mining and Design need to work
together to turn EDM more accessible.
2.2
User
Experience (UX)
The
investigation of user behavior while utilizing a product or service has been
happening ever since computers were not popular. With the advance of computer
systems that became a part of everyday life, Human-Computer Interaction (HCI)
emerged to study how people interact with computer technology. Later on,
[Norman et al. 1995] came up with the term User Experience to describe the
human interface research they have done at Apple.
User
experience goes beyond a pretty and modern user interface, it focus in the
entire user journey to make the user interaction process simple and intuitive.
An experience might be something subjective by the fact that every person has a
unique story and perception of the world. Despite this subjectivity, the experiences
were once thought by somebody and that they had a common goal in mind in order
to grant a pleasant experience [6].
There
are many facets that influence the user experience. UX has to consider more
than the context of a user interacting with some content [7], a great experience
contemplates a few more items and that is why he developed de UX honeycomb that
is illustrated in Figure 1.
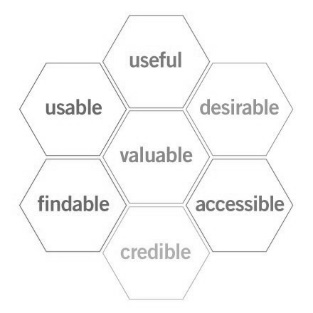
Figure 1: User Experience Honeycomb. Fonte: Morville (2004) [7].
These
are the seven factors that affect UX, a system needs to be useful, usable, findable,
credible, desirable, accessible and valuable. Useful because it presents a
purpose or objective, usable to help users achieve their goals, findable so
users can easily find the content they need, credible to deliver confidence,
desirable because aesthetics brings value, accessible to reach people with
different abilities, and valuable to deliver benefits to the users. Thinking
about all of these, this paper is focusing on the Useful factor since we are
analyzing the usability of a system.
2.3
Nielsen’s
10 Usability Heuristics
Heuristics
are a manner of problem solving based on previous experiences. Its techniques
are an simple way to identify issues based on a preceding set of rules. In user
experience design a heuristic evaluation is a method to find usability problems
when an evaluator checks an interface. There are multiple sets of heuristics
that have been created such as Shneiderman eight golden rules [8] and Bastien and Scapin ergonomic
criteria [9]. In this study, to follow heuristics well established in the
market, Jakob Nielsen’s 10 usability heuristics were chosen.
Jakob
Nielsen conducted a study to synthesize a new set of heuristics so that the
maximum number of usability problems that appear in real systems could be taken
into consideration [10]. These heuristics were proposed
decades ago, but it remains applicable to modern softwares. Jakob Nielsen is
one of the founders of the Nielsen Norman Group, a UX research firm. Nielsen
presents recent content and the 10 heuristics displayed there are the following
[11]:
1.
Visibility of system status;
2.
Match between system and the real world;
3.
User control and freedom;
4.
Consistency and standards;
5.
Error prevention;
6.
Recognition rather than recall;
7.
Flexibility and efficiency of use;
8.
Aesthetic and minimalist design;
9.
Help users recognize, diagnose and recover from errors;
10.
Help and documentation.
2
3
3
Materials
and Methods
To
verify the usability of FMDEV in order to propose an improved experience to our
new users, the analysis was performed in two steps: A heuristic evaluation and
an usability test.
3.1
The Interface
Figure 2: FMDEV’s Home Page. Fonte: The author.
Figure
2 shows the interface of FMDEV’s home page. This framework was made thinking
about an unusual target audience in order to democratize the use of EDM. It
gives the users the possibility to connect with LMSs like Moodle through an API
and also add separate data sources from .csv files.
The
goal is after selecting the data the user has to separate which data goes to
the pre-processed dataset and then train this data to output a data model. All
of this is meant to be done without a deep knowledge of data mining techniques
and machine learning algorithms. It is supposed to be an easy way to apply data
mining to education data.
3.2
Subjects
The
heuristic evaluation was done by the author of this project as the evaluator.
Regarding the test script we firstly had to define the user persona in order to
recruit the right participants. A user persona represents the target audience
aimed to be analyzed in our research. So, that would be non-technical users who
manage LMSs. A total of fourteen people, contacted through indication and LMSs
groups, showed interest in participating. Only five finished the necessary
steps of the test to be counted as a valid participant.
3.3
Scenarios
Two
scenarios were proposed to the participants so they could perform it during the
usability test. In the first scenario the user would try to save a model using
data already available, such as Moodle, and the second one was to save a model
with sample data given in an attached file. Both scenarios did not have any
specific task that needed to be detailed, the main idea was to set a goal and
see how the users were behaving in order to achieve it while using the system.
3.4
Procedure
3.4.1 Heuristic
Evaluation
The
first step of the evaluation consisted in the examination of the system
interface by the evaluator. The FMDEV had an implemented version that was
hosted online to facilitate the tests, so the person had access to the system
to start the heuristics evaluation. By using the FMDEV, the person had to
follow these steps when an usability problem was found: Write the page and
component where it occurred, describe the problem, correlate the problem with
one of the 10 heuristics, rate the severity of the problem and propose a
possible solution.
All
of the information about the found usability problems were stored in a
spreadsheet. The template is presented in the results section. One thing that
is worth mentioning is how the severity rate of a usability problem was
decided. The severity rate of a usability problem combines three factors:
frequency, impact and persistence [12]. From that, a rating scale from 0 to
4 measures the problem severity. Table 1 shows a description of each rate
number that he proposed.
The
act of choosing a value from the rating scale brings up some degree of
subjectivity from the evaluator [12].
Table 1: Severity rate of usability problems.
|
Rate
|
Description
|
|
0
|
I don’t agree that this is a usability problem at all
|
|
1
|
Cosmetic problem only: need not be fixed unless extra time
is available on project
|
|
2
|
Minor usability problem: fixing this should be given low
priority
|
|
3
|
Major usability problem: important to fix, so should be
given high priority
|
|
4
|
Usability catastrophe: imperative to fix this before
product can be released
|
3.4.2 Usability Test
Being compliant with usability heuristics is an effective way to
cover issues and prevent further problems to the end users. On the other hand,
a great user experience can only be delivered if the system was tested [13]. Testing is
the only way to see if a site really works. Through a usability test it’s
possible to understand the behavior of real users by observing how they perform
a certain activity.
There are different types of usability testing, it can be
in-person or remote, moderated or unmoderated. Despite the type or the platform
used, a test involves a participant that performs tasks given by a facilitator.
In this study we performed a remote unmoderated test. Figure 3 shows the
information flow of this kind of test.
The choice of a remote test was mainly made because of the
COVID-19 pandemic. In-person tests would be difficult and not recommended
considering the social distancing policies and protocols. To that end, an
unmoderated test was preferred over a moderated since the sessions could be
done at the pace of the participant without a specified time.
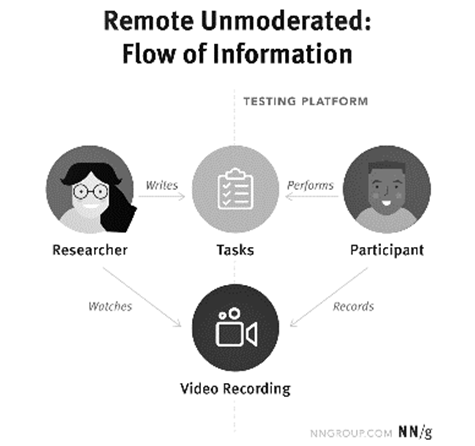
Figure 3: Remote Unmoderated Test. Fonte: Moran (2019) [14].
Regarding
the test script we firstly had to define the user persona to recruit the right
participants. A user persona represents the target audience aimed to be
analyzed in our research. So, that would be non-technical users who manage
LMSs. After getting in contact with the prospects, a willing participant
received an email with the following content: A presentation video about the
FMDEV. The video is only to show the purpose of the framework and introduce its
features. It is not a tutorial, because that could comprise the test results. A
brief information of the type of the test. To record the screen the test
environment was configured with Smartlook, a tool that automatically capture
users’ events while they interact with the system. Then the credentials to
access the test environment was provided and two main tasks were proposed.
First the user would try to save a model using data already available, and the
other one was to save a model with a sample data given in an attached file.
Lastly, the user had to answer a survey.
The
survey had fifteen questions and an optional open space to additional comments.
The first section had five questions about general information to learn a bit
further of the user’s background. The other section was thought to generate a
quantitative indicator of the system usability. With that in mind, the ten
remaining questions were from the System Usability Scale (SUS) proposed by J. Brooke
as a method to measure usability [15]. Taking all of this into account,
when a user completed the last step of the test responding to the survey, the
facilitator would start analyzing the video recordings and survey responses.
4
4
Results
This
section presents the results collected from the whole usability analysis. The
heuristics evaluation brought up usability problems. From the usability test
there is the data generated in the Smartlook tool from the video recordings and
FMDEV’s usability score collected through the survey that was previously
mentioned.
4.1
Usability Problems
After
finishing the heuristics evaluation a few usability problems were found, Table
2 shows the number of errors of each heuristic analyzed.
Table 2: Number of usability problems per heuristic.
|
Heuristic
|
Number of
problems
|
|
Visibility of system status
|
1
|
|
Match between system and
the real world
|
1
|
|
User control and freedom
|
1
|
|
Consistency and standards
|
2
|
|
Error prevention
|
1
|
|
Recognition rather than recall
|
1
|
|
Flexibility and efficiency of use
|
1
|
|
Aesthetic and minimalist design
|
0
|
|
Help users recognize, diagnose,
and recover from errors
|
2
|
|
Help and documentation
|
1
|
Regarding
the visibility of system status a problem was found in a list of indicators
that the user chose to be preprocessed, this list was too long some of the time
and it was not showing properly all the indicators. This problem was classified
with a severity rate of two as a minor usability problem. A possible solution
to this is the implementation of a pagination.
Considering
the match between system and the real world, when a user had to configure the
model training the parameters had a specific name that was not familiar to the
users’ language. It was a minor problem that could be fixed by adding tooltips
to each parameter explaining their meaning and role in the training process.
User
control and freedom allows the user to have options to come back easily to a
previous state of the system. FMDEV’s users that clicked in the toolbar to see
the saved models lost all their progress unless they had an ongoing training.
This has a severity rate of four indicating that it is a usability catastrophe.
One way to avoid it would be adding a confirmation step before redirecting the
page or providing a way to save the current state so the user could come back
to it later after navigating to the saved model’s section.
The
evaluation of consistency and standards brought up two problems. The first one
was when the user saved a model it needed to add some text to a section called
model details, later when the user moved to the saved models page this text was
in a section called model description. This is a cosmetic problem only and it
has a severity rate of one. This would be easily solved by adding the same
label to both text sections. The second problem was about the FMDEV’s logo in
the toolbar, when the user hovered over it a click pointer was shown but when
the user clicked nothing happened. A standard used in a broader number of web
systems is that when the user clicks in the logo the system redirects to the
home page, so this could be a possible solution to this minor usability problem.
Looking
at the error prevention heuristic, the problem found was when selecting the indicators,
the user needed to choose the target indicator in order to continue. If the
user forgot to select it a message would pop up, but one way to make it simple
and prevent this kind of error is to automatically add the target indicator to
the list. This is a minor usability problem with a severity rate of two. When
the user looked at a saved model, they needed to remember which parameters were
utilized in the training since it was not shown in the saved model page. So, in
order to be compliant with the recognition rather than recall heuristic and
overcome a severity rate two problem it would be better to show training
information and relevant data related to the saved model.
Observing
the flexibility and efficiency of use of the system, a minor usability problem
was found. The user does not have any way of filtering the chosen indicators,
even with a pagination to present these items in a better way it would be great
to have a few filters available.
FMDEV’s
aesthetics is simple and it does not have a lot of pages and dialogues, so
through this heuristics evaluation it was not found any problem worth to
mention that it is not even a usability problem at all. Regarding the error
recovering there was a severity rate four problem that prevented users
utilizing the Windows operating system to upload a .csv file. The last
heuristic is about help and documentation and currently there is no user
documentation or help area. This was classified as a major problem with a
severity rate of three. A FAQ, first log in onboarding and short tutorial
videos should be considered to solve this problem.
4.2
Smartlook Information
Navigating through the system and evaluating its compliance with the 10
Nielsen’s Heuristics gave a nice perspective of a few problems the users would
encounter while utilizing the system. So, to validate these problems and see if
they were actually something relevant to our target users the user testing was
made. After the usability test the data collected by Smartlook was analyzed and
most of the problems shown in the previous section happened with the users.
The
video recordings and metrics revealed that there were rage clicks in the logo
where seemed to be a clickable area, a few users received the error message to
choose the target indicator that was forgotten and needed to be selected, a significant
amount of time were spent looking at the list of chosen indicators, users lost
they progress clicking not only at the saved models button at the toolbar but
also with a misclick at the add button too. These are just some of the cases
that could be confirmed through observation.
Other
feedback was sent in the survey and new problems like unusual errors were found
only by the usability test. Figure 4 shows a heatmap of FMDEV’s main page to
show the most clicked areas of the page. Inside Smartlook the heatmap is
interactive and can indicate the exact number of clicks in each of these areas.
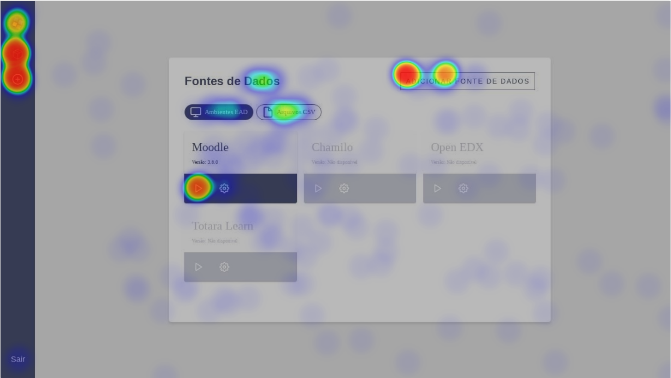
Figure 4: FMDEV’s Heatmap. Fonte: The author.
4.3
Usability Score
The
System Usability Scale was calculated based on the questions listed in Table 3.
Each question could be answered within the range of 1 to 5 where 1 means that
you strongly disagree with the question and 5 that you strongly agree. To
calculate the score the questions were divided into even and odd. Based on the
question parity the answer value would have a different number on the score
calculation. With that in mind, the answer value of Q1, Q3, Q5, Q7 and Q9
needed to be decreased by 1. On the other hand, even question answers were the
result of 5 minus the value. Therefore, the value of 5 is considered as 4 if it
was the answer to an odd question and 0 if the question was even.
Table
3: SUS Score Questions.
|
Number
|
Question
|
|
Q1
|
I think that I would like to use this system frequently
|
|
Q2
|
I found the system unnecessarily complex
|
|
Q3
|
I thought the system was easy to use
|
|
Q4
|
I think that I would need the support of a
technical person to be able to use this system
|
|
Q5
|
I found the various functions in this system were well
integrated
|
|
Q6
|
I thought there was too much inconsistency in
this system
|
|
Q7
|
I would imagine that most people would learn to use this
system very quickly
|
|
Q8
|
I found the system very cumbersome to use
|
|
Q9
|
I felt very confident using the system
|
|
Q10
|
I needed to learn a lot of things before I could
get going with this system
|
After
that, all the new score values were summed up and then multiplied by 2.5 to
make the SUS score. Table 4 shows the original score that the five users who
participated in the usability test gave to each question and the SUS score as
result for their answers.
Table 4: FMDEV’s SUS Score.
|
User
|
Q1
|
Q2
|
Q3
|
Q4
|
Q5
|
Q6
|
Q7
|
Q8
|
Q9
|
Q10
|
SUS Score
|
|
U1
|
4
|
2
|
3
|
5
|
4
|
4
|
2
|
4
|
2
|
5
|
37.5
|
|
U2
|
3
|
4
|
2
|
5
|
5
|
3
|
3
|
3
|
4
|
4
|
45
|
|
U3
|
3
|
5
|
2
|
5
|
4
|
4
|
3
|
4
|
2
|
5
|
27.5
|
|
U4
|
5
|
3
|
3
|
5
|
1
|
1
|
3
|
1
|
5
|
2
|
67.5
|
|
U5
|
4
|
1
|
5
|
2
|
2
|
2
|
5
|
1
|
4
|
2
|
85
|
Adding
the SUS score of all participants and dividing them by 5 gives us an average
score of 52.5. Bangor proposed an adjective rating corresponding to the mean
SUS score ratings [16]. Then, according to Figure 5 FMDEV has an OK usability
score.
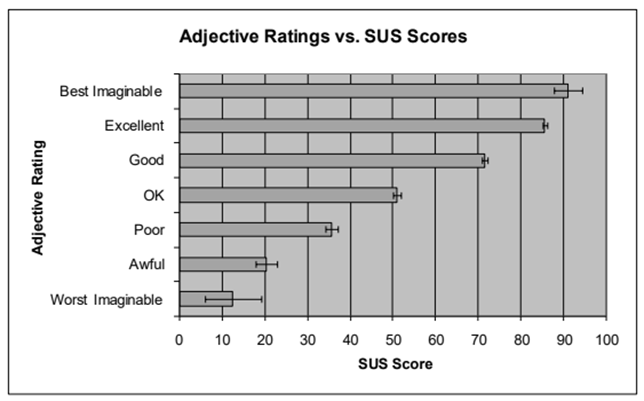
Figure 5: Adjective Rating. Fonte: Bangor et al. (2009) [16]
5.
Conclusions
and Future Work
The results demonstrate that an usability analysis is crucial to
understand your users and check if their previously designed journey is being
accomplished. Even though a Heuristic evaluation is an easy way to find
problems throughout the whole system and most of these problems were truly
happening with the users, it does not discard the possibility of a user
testing. A usability test session with the target users is still important to
validate your system and its use in the real world.
These findings suggest
that the FMDEV has the potential to establish a better user experience to
non-technical users by investigating their behavior and solving the issues that
are in the way of achieving their goals in the system. An OK rating brings up
the possibility of further analysis. Regardless of solving all the problems
mentioned in this project, future research should look for a slightly bigger
number of users participating in the tests to receive new feedback and
revalidate the SUS Score. Another interesting topic for future work is the
integration with a Learning Analytics Dashboard to provide an adequate
visualization of the indicators used to train the models and even a better way
to present the saved models statistics and information.
References
[1] ROMERO, C. and VENTURA, S.
(2010). Educational data mining: A review of the state of the art. Systems,
Man, and Cybernetics, Part C: Applications and Reviews, IEEE Transactions on,
40:601 – 618.
[2] ROMERO, C., VENTURA, S., PECHENIZKIY,
M., and BAKER, R. (2010). Handbook of Educational Data Mining. CRC Press, 1st
edition.
[3] GORDILLO, A., BARRA, E., AGUIRRE, S.,
and QUEMADA, J. (2014). The usefulness of usability and user experience
evaluation methods on an e-learning platform development from a developer’s
perspective: A case study. IEEE Frontiers in Education Conference (FIE)
Proceedings, pages 1–8.
[4] HARRATI, N., BOUCHRIKA, I.,
and A. TARI, A. L. (2016). Exploring user satisfaction for elearning systems
via usage-based metrics and system usability scale analysis. Comput. Hum. Behav. 61, page 463–471.
[5] BANDEIRA, M. ,SANTOS, N., RIBEIRO, V., GAVIÃO NETO, W. (2016). Mineração
De Dados: A Nova Maneira De Compreender O Comportamento Do Usuário Do Ensino A
Distância. Congresso Brasileiro de Pesquisa e Desenvolvimento em Design, pages
2536–2548.
[6] TEIXEIRA, F. (2014). Introdução e boas práticas em UX Design. Casa do
Código, Vila Mariana, São Paulo, 1st edition.
[7] MORVILLE, P. (2004). User experience design. [Online; accessed May-14-2020].
[8] SHNEIDERMAN, B.,
PLAISANT, C., COHEN, M., JABOCS, S., ELMQVIST, N., and DIAKOPOULOS, N. (2016).
Designing the User Interface: Strategies for Effective Human-Computer
Interaction. Pearson, 6th edition.
[9] BASTIEN, J. and SCAPIN,
D. (1992). A validation of ergonomic criteria for the evaluation of
human-computer interfaces. International Journal of Human–Computer Interaction,
4(2):183–196.
[10] NIELSEN, J. (1994a).
Enhancing the explanatory power of usability heuristics. Proc. ACM CHI’94 Conf.
(Boston, MA, April 24-28), pages 152–158.
[11] NIELSEN, J. (2005). 10
usability heuristics for user interface design. [Online; accessed May-14-2020].
[12] NIELSEN, J. (1994b).
Severity ratings for usability problems. [Online; accessed June-10- 2020].
[13] KRUG, S. (2014). Don’t
make me think, revisited : a common sense approach to Web usability. New
Riders, Berkeley, Calif., 3rd edition.
[14] MORAN, K. (2019).
Usability testing 101. [Online; accessed July-01-2020].
[15] BROOKE, J. (1996). A
‘quick and dirty’ usability scale. in jordan p.w., thomas b., weerdmeester
b.a., mcclelland i. l. (eds.) usability evaluation in industry. Taylor Francis,
London, pages 189–194.
[16] BANGOR, A., KORTUM, P.,
and MILLER, J. (2009). Determining what individual sus scores mean: Adding an
adjective rating scale. JUS - Journal of Usability Studies, 4:114– 123.